
Distribution of SAR Incidents in BC
I was at a meeting last night and heard a SAR member state a bald claim that the Southwest region of BC has more incidents than the rest of BC combined. I was pretty sure this was not the case – so I set out to generate some simple statistics from the InfoSAR project.
The Incident Summaries are not explicitly spatially indexed, which is to say they do not have explicit coordinates associated with each incident . However, each one is assigned a region, and we can do some quick comparisons with them..
PEP splits British Columbia into six regions as shown on the map below (map source)
![PEP Region Map_thumb[1]](https://blog.oplopanax.ca/wp-content/uploads/2010/12/PEP-Region-Map_thumb1.jpg)
The following chart shows the percentage of the total number of incidents for each region since 2003
![SAR Incidents by Region_thumb[7]](https://blog.oplopanax.ca/wp-content/uploads/2010/12/SAR-Incidents-by-Region_thumb7.png)
As you can see, the southwest region of BC only accounts for a little over a third of the SAR tasks in all of BC. Vancouver and area contain approximately 2.254 million people, which is approximately 54% of the population of BC (as of 2007), so the rate of incidents per person is lower than the rest of the province.
The table below summarizes some comparisons between the southwest region and the rest of BC
| # Incidents since 2003 |
% of total | Population (million) |
Incidents / 1000 people |
|
| Southwest | 3050 | 36.6% | 2.15 | 1.35 |
| Rest of BC | 5282 | 63.4% | 1.87 | 2.81 |
So the rest of BC has roughly twice as many tasks per person since 2003 than the southwest region.
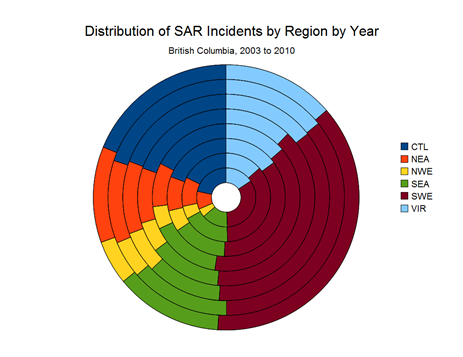
In the next chart, I separated each year into a ring in the pie chart, creating a doughnut chart, the innermost ring being 2003, and the outermost being 2010. This shows that the regional distribution of incidents for southwest BC has never been more than approximately 36-37% of the total incidents for any year. The distribution seems to be fairly stable, with the exception of the Northwest region, since 2003.
Analysis
The distribution of tasks probably has more to do with the distribution of recreational activities than with population, and the type of tasks probably also reflects this. It also probably has to do with access to wilderness, and areas with easier access or with greater popularity seeing more tasks. In a future post I’ll attempt to analyse the types of tasks.
This is the simplest form of analysis possible given the data; a more complex analysis would take the data and assign geographic coordinates to the location of each incident (possibly an area for larger incidents), and generate a heat map showing the density and distribution in a more intuitive and granular way.
Of course, even the simple statistics above can be prone to problems; a backcountry accident depends on people, and where they travel – things that do not obey the simple rules of drawing a jurisdictional, or organizational boundary on a map. Simplistic analysis can lead to problems such as the locational fallacy, or the modifiable areal unit problem (MAUP); the ignorance of these problems has cost millions of dollars and many lives in the past.
While you break these number down by population, what does the graph look like when you break it down by area? I could see the South West have more incidents per square km than the rest of the province combined.
Also, while the PEP data indicates the region, it does not address the use of mutual aid from teams across these boundaries. For example the hang glider on Saltspring this Summer would be a Van Isle incident, but used both Van Isle and South West resources. Also, mutual aid may result in more SW teams tasks because of the convenience of mutual aid. While your statements are specific to incidents only, I would be very interested to see the numbers on the actual tasking of teams. Here also, I could see that South West teams are tasked more than the rest of the province combined. (based entirely on conjecture)
Good point on breaking down by area; I guess if I had the shapefiles for the regions we could get exact numbers, but my gut says the density of incidents in the southwest is higher than the rest of the province.
For mutual aid, team in the southwest tend to help other teams in the southwest – I don't have number to back this up yet, but it's a planned extension of this project to link each team to the tasks they led or assisted on. I don't think it would change the results much – only by a maximum of 5 to 10 incidents per year.
The big things going for the numbers on the south coast is just that density. If you look the total area and the number of people living in it the calls per density are definitely higher than the rest of the province for sure.
Of course the interesting thing to keep in mind is that the number SAR teams in the south coast make mutual aid faster, what i mean is if you call for mutual aid the teams can be there in around an hour. in the north here it can take up to 3-4 hours.
The other thing i find real interesting is that there are some sar teams that cover an area that is close to the whole south coast region.