Accidents in Incidents: A review of SAR-related injuries
Any reader of my blog knows I love numbers. Collecting information can tell you a lot of things; it can tell the shape of a problem, whether the problem is big, small or insignificant, and it can define problems that have not been recognized yet.
SAR members in British Columbia are lucky to have the Provincial Emergency Program to track and publish SAR-related numbers. Recently I found out that in addition to collecting and publishing information on SAR incidents in BC, they also collect information on injuries that happen to SAR members while on a task.
These incidents-within-incidents are informative for several reasons; they can show how careful SAR members are when performing tasks, and show where even SAR members are prone to certain types of accidents. When looked at carefully, they can provide guidance on where a change in policy, equipment or procedures could make our work safer. It can also help SAR teams going forward to prevent accidents. PEP recently commissioned a study of these accidents, which I managed to get a copy of.
What follows is a review of this study, with reference to data collected in the PEP incident summaries, and the InfoSAR project.
Note:
I did not get access to the data this study was based on myself, so all numbers and charts presented below come from the author of the report. My source for the report states that it is public, and my use of any stats, quotes and graphics in this blog for the purposes of news reporting and criticism are considered to be fair dealing under Canadian Copyright law. The report was prepared by Kathie Stenton, a consultant. No content in the report states who it was prepared for, or any qualifications or contact information for the author. A link to the report PDF is at the end of this post.
The Data
The accident data pertains to injuries SAR members sustained while on tasks and training. When a SAR member is on a task or training in BC, they are covered by WorkSafe BC (WSBC). This means any injury is covered, including those that result in impairment and time off the volunteer’s regular employment. The accident data comes directly from reports to WSBC, so it probably includes any injury more significant than a scratch or sprain – having been involved in two such reports, one for myself and one for a team member I’m aware of how seriously such incents are treated.
The data consists of 387 separate reports dating back 40 years (the earliest being 1969), 80% of these (281 reports) are from SAR and PEP air (CASARA) personnel, the remainder are from the other 3 disciplines of public safety volunteers (Emergency Social Services, Emergency Radio Communications, and Road Rescue). The data is counted in terms of injuries, and not people – a SAR members injured more than once in their time as a volunteer will count for more than one injury. A single incident with more than one injury counts as a single report.
In the following review I will compare the injury statistics with the number of tasks in BC. The time frame of the injury data does not exactly match the incident data, however since there were so few injuries reported in the early part of the data I will assume that the numbers, especially when broken down by region and by season, represent a proportionality and are approximately correct for the purposes of describing injury per task.
Analysis
Although this report purports to be an analysis of SAR injuries, the only data that is presented is raw statistics on the injuries themselves. The major question when presented with a statistic such as a number of injuries is: Compared to what? SAR Members can’t get into an accident unless they are on a task, so it would make sense to relate the accidents to the number of tasks. Without such a comparison there is no way to tell if there is a trend in SAR accidents, and if that trend is positive or negative.
As I will show below, the report in fact comes to several erroneous conclusions due to this lack of comparison.
Injuries over Time
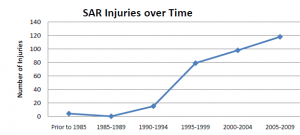
SAR injuries are increasing over time, but so are the number of tasks. Without comparing the number of injuries with the number of tasks in a year there is no way to tell if the accident rate is increasing, so reporting the raw numbers does not necessarily reveal a problem. The chart below is reproduced from the report.
The data in the SAR injury report shows a jump in injuries reported between 90-94 and 95-99. The jump is from 15 injures in 90-94 to 79 injuries in 95 to 99, or 64 injuries over the 5 year period: an 81% change!
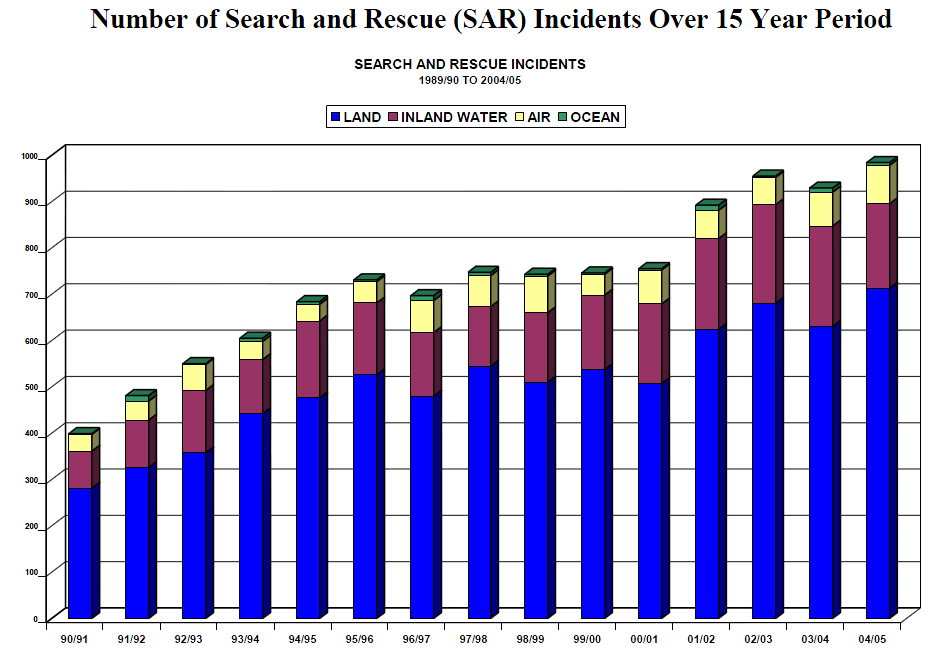
The current summary from the PEP web site contains the following graph, showing data from 1991 to approximately the present:
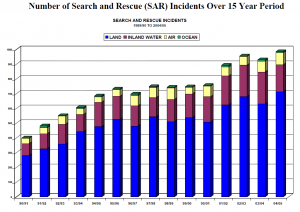
The corresponding period in the chart of the number of incidents shows no such leap; on the contrary it is a very flat portion of the chart. It is difficult to explain this discrepancy. Some possibilities include a change in how records were kept, a change in the type of tasks, or a change in how SAR members respond to tasks. It has to be some sort of anomaly; without further details on how the data was gathered, it is impossible to know.
I’m very disappointed that the report writer didn’t include a year-by-year summary of injuries, and instead decided to report the injury rates over time in blocks of five years. Even with fluctuations each year is should be possible to calculate a trend.
In any case, the report states that the last decade has shown an average of 21 injuries per year, an accident rate lower than 2% (number of injuries divided by number of tasks), considering that there are over 1000 tasks per year not including training tasks, for which accidents are also reportable.
Injuries by Time of Day
The breakdown of injuries by time of day do not seem to be overly interesting. There is some slight skewing toward the daylight hours, but without comparing this to when tasks are happening, as stated above, the raw numbers are not very helpful.
There is speculation in the report as to whether darkness is a factor in injury rates. Again, without comparing the number of accidents at any given time of day to the total number of tasks at that time it’s impossible to come to any conclusion.
Injuries by Season
I’ve written before on the frequency of SAR incidents, and while time of day and duration data are hard to come by (see above), the day, month and year data are quite easy to use. I prepared a table comparing the percentage of injuries by season to the percentage of tasks per season.
| Season |
# Injuries
|
Percent
of Injuries |
Percent
of Tasks |
|
Spring
|
64
|
23%
|
22.5%
|
|
Summer
|
87
|
31%
|
37.5%
|
|
Fall
|
59
|
21%
|
22.3%
|
|
Winter
|
70
|
25%
|
17.6%
|
A chart comparing the values shows that although there is a slight skew of injuries in the summer, it does not keep pace with the percentage of tasks in the summer months. The following chart also shows that while the injury rate remains high in the winter, the number of tasks drops, so the injury rate expressed as injuries per task, is greater in the winter.
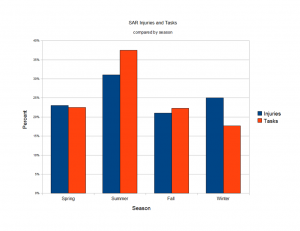 A cause for concern is that the report concludes that SAR Volunteers are more likely to become injured in the summer than the winter. It is in fact impossible for the report writer to reach this conclusion without comparing the number of accidents to the number of tasks, giving an accident rate per task. When this comparison is done we find that the report is wrong.
![SAR Injuries per Task by Season[4]](https://blog.oplopanax.ca/wp-content/uploads/2011/01/SAR-Injuries-per-Task-by-Season4-300x231.png) This chart makes it clear that the chance of a SAR member being injured per task is roughly double in the winter, and that you are least likely to be injured in the summer.
This chart makes it clear that the chance of a SAR member being injured per task is roughly double in the winter, and that you are least likely to be injured in the summer.
Injuries by Region:
Again, this breakdown of the percentage of injuries is worthless unless compared to the percentage of tasks in each region. I’ve done this below:
While the report lists the “frequency” in injuries as highest in the Southwest, at 39%, when the number of incidents is expressed as an actual frequency of injuries per incident, we can see that Vancouver Island has the highest injury rate in the province, despite having a very low number of incidents. Looking at the two outliers (Vancouver Island and Northwest BC), these two regions together are roughly 1.7 times the injury rate per incident than the rest of the Province.
This is an interesting chart. It could be explained by these regions being more serious at reporting incidents, or it could indicate some lapse in safety procedures, protocols or policy. It’s also possible that teams in these regions are involved in different sorts of rescues that are more prone to injuries. Delving deeper into the actual accident reports we could find a pattern. This should be studied further as it could be an easy way to prevent a SAR member’s injury or death.
Cause of Injury
The causes below are as determined by the WSBC:
| Cause |
Number
|
Percent
|
| Slip or Trip |
75
|
24.9%
|
| Fall |
35
|
11.6%
|
| Struck |
32
|
10.6%
|
| Sharp Edge |
30
|
10.0%
|
| Other |
31
|
10.3%
|
| Twist |
23
|
7.6%
|
| Over exertion |
14
|
5.0%
|
| Lifting |
12
|
4.0%
|
| MVA |
11
|
3.7%
|
| Crush |
9
|
3.0%
|
| Repetitive |
3
|
1.0%
|
| Animal Bite |
3
|
1.0%
|
| Harmful Substance |
2
|
.7%
|
| Assault |
1
|
.3%
|
| Unknown |
19
|
6.3%
|
I’ve written before about how dangerous a slip and fall injury is in the mountains, and how this type of accident, although not spectacular, is under reported and possibly not expected by backcountry enthusiasts. These statistics show that SAR members are also vulnerable to the same sort of accident; the chart below illustrates the proportions.
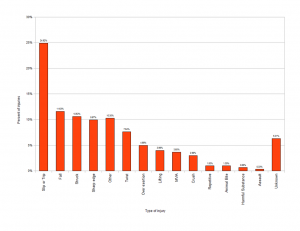 The source document states that a typical scenario for a “slip or trip” accident was wet or icy ground, rock or log, and a fall that results in an injured knee, ankle or wrist. The typical scenario for a “fall” was a fall down an embankment, falling on snow while on skis, or falling off a snowmobile.
Knowing that SAR members are more likely to be injured in the winter (see above), the cause of injury, and the types of injuries are no surprise. The combination of “slip or trip” and “fall” causes accounts for almost 40% of SAR injuries.
Fatalities
Somewhat sadly, there are 7 reported fatalities in the accident data (7 SAR members who died on tasks or training events). The fatalities were in 4 separate incidents. 2 were plane crashes in which five volunteers died. For the remaining two incidents, one was an ice climbing accident, and the other was a mud slide.
Summary
While the goal of the report on volunteer injuries in BC is a valuable one, many of it’s finding are suspect due to incomplete data, no comparison of injury rates to incident rates, and no examination of data collection methods. No attempt was made to relate the injury statistics to the number of Task hours, or the number of tasks. When the injury distributions are compared with task distributions, several of the report’s findings were found to be incorrect. The first, that SAR members are more likely to be injured in a summer task, is wrong; injuries per task are almost double in the winter. The second, injury frequency is higher in the southwest region is also wrong: injury rates per task are much higher on Vancouver Island and the Northwest.
These, and other errors and mistaken conclusions in the report, are attributable to the author possibly either not having access to the data, or not having access to the data in a form where it could be easily manipulated. The task of the InfoSAR project is to make this process easier for all parties. As can be seen from this post, having access to this data can help properly determine the causes and factors contributing to injuries, and could help prevent injury and save lives.

![SAR Injury Rates by Region[4]](https://blog.oplopanax.ca/wp-content/uploads/2011/01/SAR-Injury-Rates-by-Region4-300x231.png)
Mike,
Good analysis. I would offer a couple of comments: the original report was an analysis of accident reports, not of accidents. This is an important distinction. One factor that could change the rate of “accidents” is a change in the rate at which they are reported. It has been my experience that in the past, many accidents went unreported. With time, perhaps, attitudes have changed and a larger proportion of them are being reported. This may not be a direct reflection of the rate of accidents themselves, but just an increase in the rate of their reports. This distinction could not be available for analysis based on the type of data available; only the accident reports.
Another important factor in the day vs. night discussion, is that some SAR groups do not search at night. That would obviously skew the results in that category.
Nice to have peers like you reviewing my writing Bob. I certainly hope you didn’t write the original report?
You’re right of course, the report is about reported accidents and not accidents, so it’s actually about accidents that resulted in injury that met a certain threshold of seriousness that someone thought they were worthy of reporting. Like all statistics, it’s a sample of a “real” number somewhere out there, much the same as crime rates are reported crimes, and are a sample of what the real crime rate is. This report suffers from the same basic problems as the crime rate problem; there are ways to project the “real” variable from the sample, but no effort has been given to this by either the study author, WorksafeBC, or me.
That being said, we’re left analysing the reported incidents.
I may not have been clear, but since I only had incident data from the 90’s onward, my analysis only took into account the last 20 years of tasks. If the tasks from the 90’s and charted against the injuries reported over the same period there’s no sudden “jump”, just a nice smooth linear increase of accidents as the number of tasks increase, so in the end I don’t think there’s really a mystery to be solved that would require us to postulate some change in the number of accidents that are reported; when compared the the tasks for that period they are consistent.
The study author still gets the main points I wrote about wrong; their claim that most accidents happen in the summer, and that most accidents happen on the south coast is true in that the absolute number of accidents is in fact greater, but when compared to the number of tasks the “problem” is shown to be in the winter, and on the Island.
It’s possible since there are so many teams on the Island that there are more injuries during training, or that somehow their managers are trained slightly differently and are more careful to report all accidents. I guess my point is that if someone was interested, this would be worth investigating.
Again, it’s really nice to have someone read something I put some work into and give constructive feedback. Thanks for commenting.