SAR Call volume up province wide

By every measure 2016 was a busy year for SAR teams in BC. Groups throughout the province have been reporting that their call volumes are up, with many teams posting their busiest years ever.
Note: please see the update at the end of this article.
With statistics from Emergency Management BC, we can see clearly just how busy the 2015 – 2016 year was.

Discussion
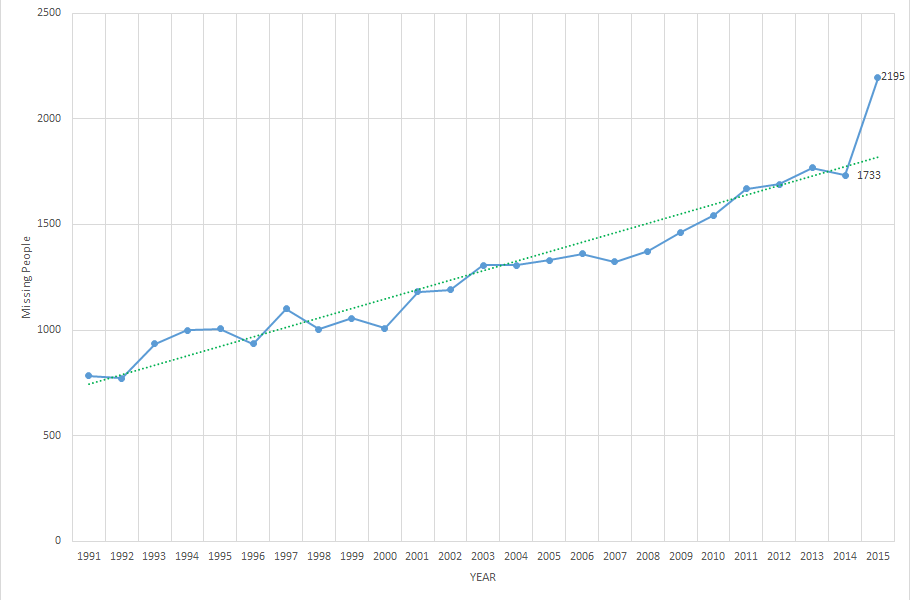
The number of people BC SAR teams rescued in 2015/16 was 25% higher than 2014/15, and is also higher than the long term trend.
The chart shows the total number of missing people that Ground Search and Rescue teams in BC were tasked to look for from 1991 to 2015/16 (see methodology below). I’ve presented it as a line chart instead of a bar chart to highlight the growth in SAR responses over these years. I’ve included a trend line on the chart that attempts to fit the data to a linear regression. The R² for the regression is 0.9072 which indicates a good fit to the data.
The numbers include all people SAR was asked to respond to including those that were found deceased, and those we never found. It includes all regions of the province and is part of EMBC yearly statistical tracking. This is not the number of SAR Tasks as there can be multiple people per task. I’ll address the number of SAR Tasks in another post.
Trends in missing people are notoriously difficult to understand and have their sources in sociological and demographic phenomenon. SAR members throughout BC often muse as to what drives the fluctuations individual groups see in their numbers. These aggregate statistics can show a province wide trend but without breaking them down by region or type of call it is impossible to develop a theory as to their cause. This is frustrating to SAR members.
Things of note
- 2015/16 shows a clear break in the main trend.
- 2015/16 shows a 26.65% increase over the previous year.
- 2015/16 is about 25% higher than the trend line.
- There is no “exponential increase” over time. Neither is it “geometric” or anything of the sort. It’s largely linear.
- On average the increase has been 86 people per year since 1992.
- The increase from 2014/15 was 462 people.
- There are approximately 80 SAR teams in BC. If spread evenly each team would have rescued an average of 27 people
- There were approximately 1,542 responses in 2015/16. If spread evenly each team would have responded to an average of 18 tasks.
- There were an average of 1.42 people rescued per SAR task
Methodology
The data in the chart above was derived from a chart published by Emergency Management BC (EMBC). I then ran that through a service that can extract data from PDFs and images to come up with the number of missing people per year from 1992 to 2016. This was necessary because EMBC does not make the raw data available for analysis. Note that EMBC reports on statistics using a financial year boundary of April 1st, so 1991 on the chart is in fact the financial year 91 / 92 and 2015 on the chart includes April 1 2015 to March 31 2016.
Update
This summary doesn’t do the rescue justice as it took over 10 hours to rescue the group.


0 Comments on “SAR Call volume up province wide”