Long term SAR Trends in British Columbia

Emergency Management BC published the yearly summary statistics for emergency response in BC and like last year I did some analysis. We now have 20 years of statistics on SAR in BC!
You may recall that last year there seemed to be a precipitous increase in SAR calls and I speculated on what the cause might be. The readers of this blog had a vigorous discussion over the past year on what might be driving this increase – ranging from simple population growth to social media, or smart phones. also came to the conclusion that whatever is driving this increase, it’s not population increase.
Compared to population
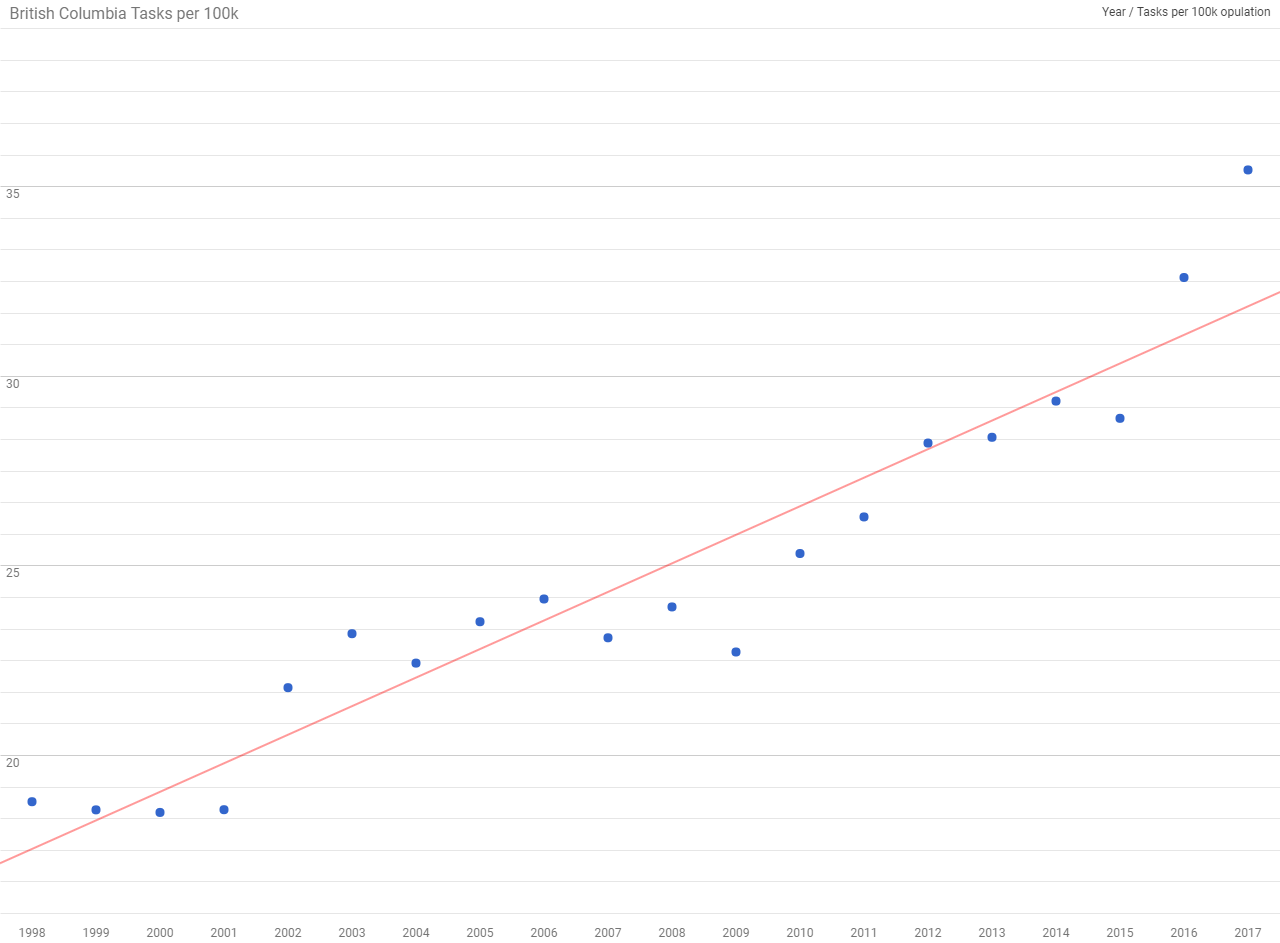
This year I’m not going to focus on the number of tasks because as many people have pointed out, when you draw charts that focus on the raw numbers you’re usually just charting population growth (more people, more hikers, more people calling for help). So this year I’m only going to present a chart showing number of tasks per 100,000 people.
The population statistics come from the provincial government. I’ve used the quarterly population estimates to plot the tasks per 100k people.
What we’d expect to see in the chart if the number of tasks were driven purely by population is an approximately horizontal line, or a line with a slope of zero. We can see two periods in the chart above with that characteristic – 1998 to 2001, and 2002 to 2009. A regression line over either of those periods would lead me to believe that tasks were being driven by population growth over that period.
However, from 2010 to the present, we’ve seen a 50% increase in number of tasks per 100k people. Since 2015 we’ve seen a 25% increase in tasks per 100k which is alarming.
Regional Breakdown
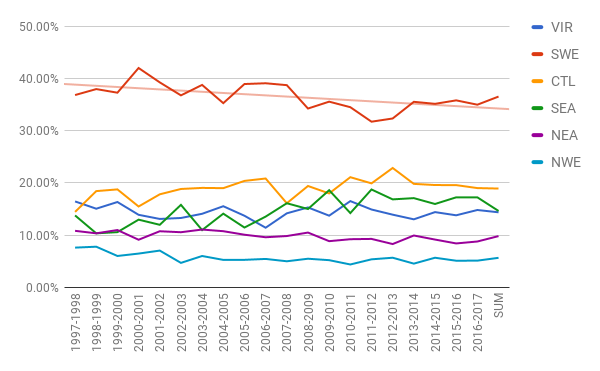
Another quick chart we can show is the percentage of the total tasks in each region of BC. This is interesting because many people, including SAR members, media and the public, are under the mistaken impression that most of the SAR tasks in BC happen in the southwestern BC which has approximately 60% of the population. As we can see from the chart below, the reality is that the southwest only accounts for an average of 36% of the total incidents.
If anything, SAR groups in the other regions of BC are doing more tasks per capita than those in the southwest.
Also of note is a slightly downward trend in the percentage for the southwest.

Another way to look at the proportions
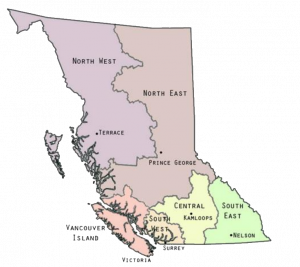
For reference, the map below shows the regions.
The Data
In an effort to get more people involved in thinking about these trends, and encourage people to try their own analysis, I’ve embedded my working spreadsheet below. Feel free to make a copy and try your own co-relations.


Solid and interesting analysis Mike. If you don’t mind I will share this within the NSS and the larger Public Safety department. I think you may also find it interesting to compare and include some of the Air and Marine incidents in the region (slightly different focus but where resources may be shared there is an affect).
On another note, will we see you at SARscene in Winnipeg (20/21 Nov 17) this year?
Cheers, Gray Newbold
Hi Graham
By all means share it, I’d be happy for some critical eyes on this.
I’m going to try to be at SARScene. I’m assisting in rolling out D4H most of October, so lots of travel coming up.
Hi Mike! A rep from the BC Wildlife Federation is looking for stats on SAR callouts for hunters in BC… have you crunched any relevant numbers recently?
Cheers,
Lauren
No, nothing recent.
BCSARA might be able to give a few stats using the new D4H system. Not all teams are using it yet. Try Kyle VanDelft?