
Calculating your own GPS accuracy

In my post on GPS accuracy I made some claims about the accuracy of GPS devices and used a graphic that was created by a third party that may have confused the issue for some people, as it appeared to show a different level of accuracy that I was writing about.
Here is how to determine the accuracy of your own GPS, based on an experiment I did last week on two of my own units.
Set up the GPS
The GPS I am using is the Garmin GPSMAP 62st (pictured right).
Turn on the GPS and let it “settle” or calculate your position. If it hasn’t been on in a while this might take as long as 15 minutes. While you’re at it, configure the GPS to record the position regardless of how far it believes it has moves since the last calculation. Some GPS units “filter” positions so they don’t introduce distances that haven’t been travelled. This is important to athletes who are using it to track how far they run. If you don’t do this step, the results are going to be very strange, as the GPS will only record wide swings in position.
It’s probably a good idea to make sure the batteries are fresh.
Choose a location where the GPS can be put, safely, for several hours and where it has a reasonable view of the sky, similar to what you might expect under the conditions you regularly use it.
Start gathering data
Delete the current track. This important step “zeros” the current recording of the track file so we start with data that’s current, and “stable” — the GPS has had the time to refine the position. We’re only interested in the current position as long as the GPS is not moving.
Let the GPS gather data for several hours. Do not move it. This is where we let the little unit do it’s work gathering data.
Retrieve data
Save the track, and download it to your computer. In my case the data is in a GPX file. I took the file and converted the latitude/longitude into UTM, because I want to express the position and error in terms of meters. I then import the data into a spreadsheet.
Analyse the data
Find the mean of the UTM coordinates (which is in meters), and use that to calculate the “delta X” and “delta Y” positions by subtracting the mean X and mean Y to create two new columns in the spreadsheet.
Calculate the standard deviation of the delta X and Y columns.
$latex \sigma=\sqrt{\frac{1}{N}\sum_{i=1}^N(x_i-\mu)^2}$
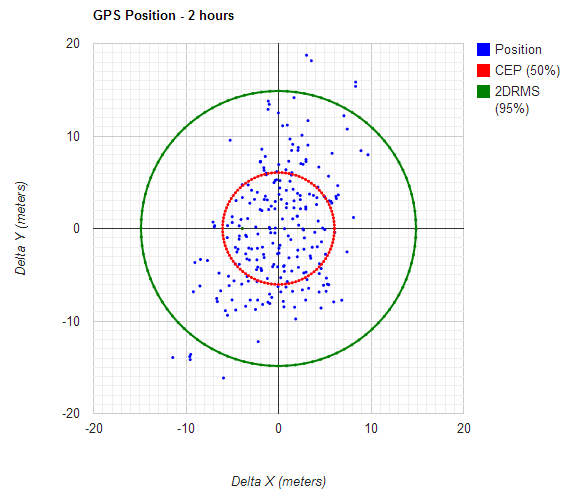
Use the standard deviation to calculate the CEP ( 50%) radius using the following formula:
$latex CEP=0.59(\sigma_x+\sigma_y)$
where $latex \sigma_x$ is the standard deviation of the easting value, and $latex \sigma_y$ is the standard deviation of the northing. In this case, the radius is 6.06 meters.
Then calculate the 2DRMS (95%) radius using the formula:
$latex 2DRMS=2\sqrt{\sigma_x^2+\sigma_y^2}$
That radius is 14.86 meters.
Finally, plot the delta X and delta Y columns, and the CEP and 2DRMS rings to help you visualize the accuracy. I present the results of my experiment, ebedded below.
[include “script”]
The spreadsheet of the data that produced this chart is available here.
Code to create the chart is available here.
Read about a comparison between a wilderness GPS and a Smartphone GPS
Anyone having trouble reproducing these results feel free to email me a GPX file and I’ll send you a quick analysis of the accuracy using this method.
For those interested, the image of the above chart is inserted here, it can be used under Creative Commons license as long as you credit the source (me).
Dear Sir,
I read your blog of GPS accuracy (Calculating your own GPS accuracy) and it’s really helpful for a new guy.
I would like to ask some questions and please kindly show me how to reach it:
1. The workflow to calculate GPS accuracy is: Get LAT/LONG -> Translate to UTM -> Calculate DeltaX and DeltaY -> Get Sigma (Standard Deviation) -> Get CEP(50%) -> Get 2DRMS(95%) -> Draw Scatter diagram. May I correct?
2. I do not know how to translate to UTM coordinates, even from your spreedsheet. It seems a lot of math in the translation. I found some pages and studying now (http://www.uwgb.edu/dutchs/UsefulData/UTMFormulas.htm). This page provided a spreedsheet to translate LAT/LONG to UTM, but when I input your data, I cannot get the same UTM coordinates. Could you show me how to use it, or do you know any library could reach it (Java / JavaScript / Python / etc.)?
3. Could I use the JavaScript you provided in the link to create the Scatter diagram?
Thx & B.R
Leo
Leo,
Yes, your step 1 is correct except I calculate the average position and use that to get the DeltaX and DeltaY. If you are near a ground control point with a known position you could use that as a known position and calculate the deltaX and Y from there, and plot it instead.
I actually wrote my own software to convert from GPX to a CSV with UTM converted.
Someone else contacted me and I advised him to use this online batch converter http://www.earthpoint.us/BatchConvert.aspx
This presupposes you have edited the GPX file into a CSV already.
The coordinates in my spreadsheet are actually Transverse Mercator (not “Universal”), or more specifically they are the “Popular Mercator Transform” as used by Google, Bing and other online mapping platforms. You should be able to get the same results with UTM as long as you are not near a zone boundary.
Feel free to use the javascript I have on the page.
I would be interested to see your results if you have time to email or post them?
Also, do you think this is something that I should write into a web page so people can upload their own GPS files and I would produce the scatterplot?
Dear Sir,
Sorry for late reply. I do not think CEP is familar to end-user. We are the manufactoring company so we need to learn it. But if you could provide an on-line service, I think it will be very popular in this industry…ccc
Do you know Garmin’s DNRGPS tool? It could calcuate CEP / 2DRMS too. But I use it to verify with your result, it’s a little big variance. But personal I think your formula is correct.
Here is the DNRGPS tool download URL: http://www.dnr.state.mn.us/mis/gis/DNRGPS/DNRGPS.html.
I also have a GPX for comparison. Are you interesting to compare this GPX file with Garmin tool and yours?
Thx & B.R
Leo
Leo;
Thanks for the tip on the DNRGPS tool, I had heard of it but did not know it tried to calculate CEP. I will give it a try with my data and see what it says.
It’s very nice to have readers like you.
Dear Michael,
It’s great to learn this topic from your blog. I am the newer of this field and have no common sense of GPS, map and cooridations. What I do is to record latitude / longitude on an Android device, then translate to UTM easting / northing (WGS84 – http://www.ibm.com/developerworks/cn/java/j-coordconvert/), then got CEP / 2DRMS. The result is different with Garin DNRGPS tool, so I would like to check with your expert experiecne:)
Dear Michael,
I have a question regard to the data file. I did not get the point for the numbers below delta x and delta Y. thanks
Dear Sir,
It was so interesting method, I would like to use it for my master thesis, but I have problem to plot the diagram, I could not get it, well I tried to share my spreadsheet but gave me error. could you please guide me in this case.
Amir; I’m not sure what you mean by “the numbers below delta x and delta y”.
As for plotting the coordinates, the easiest way is to project them into a “Web Mercator” projection which is the number of meters in the X and Y from the equator. This lets you plot the position in meters and measure the error in those same units.
Hi Michael
Thank you for your interesting posts. I must admit, i thought the error shown on my GPS would be at the 95% level (+_ 1.96 sd), so it’s interesting to find out it is not so.
I have a question though. I live in the UK and have a second hand GPSMAP 60Cx with Topo UK installed. I use it for conservation work, to help locate the nest boxes we use for the hazel dormouse, and recently used it to take locations of radio tagged adders (our only venomous snake) on our local hills. I take average readings (button on mark Waypoint page) of the grid ref and the it usually shows about 3-6m accuracy within a couple of minutes, depending on how clear the view of the sky is. I also use it to help find new walks.
I plot all of these using Mapyx Quo software on the 1:25000 UK maps.
My query is about your method of measuring accuracy of a GPS, as I always thought that to get an accurate grid ref you had to at least have walked enough to allow the device to triangulate it’s position with the satellites, and that if you just keep it stationary the accuracy will deteriorate. Does this mean that when you are moving, you get a smaller CEP than when stationary or is this wrong?
I have done a short trial of taking readings when keeping my GPS stationary, and the plot of the static ‘track’ is a random wandering over about 20+m over about 4 hours, when in fact it is just on a table in the garden. I can see that you could use statistics (as you show) with a large number of measurements over time to get a good estimate of the position this way, but does the lack of movement reduce the accuracy of the calculation of the CEP?
Many thanks.
Nick;
As far as I can tell moving the GPS receiver is not required to get a fix.
The GPS calculation can very roughly be described as “triangulation” but the math is much more involved, and too long to go into here. Suffice it to say that there must be a minimum of two, preferably three GPS satellites in view (receiving a strong signal) to achieve “triangulation” and that is all that is required. Moving the receiver does not help.
Interestingly, there is something you can do if you know your receiver will normally be moving, as is the case for automobile GPS units. It’s “expensive” to perform the calculations to derive a solution, or a “fix”. If you’re a developer of a GPS unit that you kno is normally going to me moving, you can discard calculations early on when you know the solution is going to be low quality, either because of a bad signal or some other test for the amount of error in the solution.
For example, there’s a “multipath” effect when the GPS signal bounces off an object (building, mountain etc) that will introduce error into the calculation. If you are moving, you can simply discard the calculation and take another sample in a few microseconds, when hopefully the multipath effect is gone because the receiver moved.
There are many other “hacks” that a moving GPS unit can use to make it look like the accuracy is higher than it is. By using a Kallman filter, the unit can attempt to predict the next position based on the previous positions. Automobile GPS units can also “snap” to a road, making it appear that it is very accurate when in fact it’s guessing the location based on the highest likelihood.
In summary, lack of movement does not decrease Accuracy. The 20m drift you are observing is normal, and is very similar to what I observe here. In fact you should also notice that the error skews slightly more in the north/south orientation as the accuracy is slightly lower for latitude.
Was WAAS enabled? (It looks like it is by default)
The manual for this device says that with WAAS the device should have a 95% confidence interval to 3-5 meters.
That seems pretty far off from what is shown here.
Hi Michael, excellent post. I ask you, how can you calculate the altitude’s accuracy?
Thank you very much
There’s two ways
1) compare the GPS accuracy with a standard (barometric, or LIDAR)
2) do what I did with the position and record the values over a period of time and use the variance estimate the error in the calculation.
That’s the best I can do.
2 quick questions.
1) Are you calculating GPS precision, not GPS accuracy, because you calculate the CEP etc. with regard to the mean (centroid) of the points, as opposed to the true position?
https://www.radio-electronics.com/info/satellite/gps/accuracy-errors-precision.php
2) Where did you get the 0.59 from in the CEP formula? The wiki https://en.wikipedia.org/wiki/Circular_error_probable says that CEP = 0.4163 * 2DRMS, and there seem to be other definitions out there
https://www.novatel.com/assets/Documents/Bulletins/apn029.pdf
Thanks for the question, you made me go back and look. Also noticed the latex isn’t processing any more.
1) Yes, it’s precision as a proxy for accuracy. We’re assuming that since there’s no longer any selective availability that recorded positions are in a gaussian distribution around the “actual” position. We make this assumption for the purposes of the demo and to show how the device behaves, and to give users a better insight into what the displayed confidence means.
2) The link you provided shows the formula as
CEP = 0.62 sigmaX + 0.56 sigmaY
Where sigmaX and sigmaY are the standard deviations of the X and Y components of the GPS signal. I think that there are different values for X and Y because the GPS is slightly more accurate on one axis over the other, and the charts should actually be ellipses.
if you average the two values (0.62+0.56)/2 = 0.59
CEP = 0.59 (sigmaX + sigmaY)
I don’t recall where I found this originally, even some of this links in this post are broken now. I should go back and change the formula, but it seems like a lot of work to dig up all the code and data now. I may revisit this at a future date at which point I’ll update the formulas.
Hi Michael,
Thanks for the quick reply! I am trying to reproduce these results and images using R (trying to learn R for research purposes to look at GPS on a UAV).
Sadly I spent all yesterday but have been unable to figure out how to get from Lat/Long to UTM Easting/UTM Northing in your spreadsheet. I tried the batch converter http://www.earthpoint.us/BatchConvert.aspx (set to ALL) but that didn’t work.
Here is my working R code. Note I tried all zones from 1-60 but no joy!
—-
library(rgdal)
LatLong <- data.frame(X = c(49.28805728, 49.2880727), Y = c(-122.9803498, -122.9803267))
names(LatLong) <- c("X","Y")
# Convert it to a sp object
coordinates(LatLong) <- ~ Y + X # longitude first
# Add a coordinate reference system
proj4string(LatLong) <- CRS("+proj=longlat +ellps=WGS84 +datum=WGS84")
LatLong
# Project using spTransform
Utm Utm
#SpatialPoints:
# Y X
#[1,] 501429.0 5459479
#[2,] 501430.6 5459480
#Coordinate Reference System (CRS) arguments: +proj=utm +zone=10
#ellps=WGS84 +ellps=WGS84
#——————For finding the zone
long2UTM <- function(long) {
(floor((long + 180)/6) %% 60) + 1
}
x<-long2UTM(-122.9803498)
x
—
Thankyou so much for providing this informative page and responding!
Hey Michael,
Do you happen to have a method, formula or code to calculate the HDOP, VDOP and PDOP when the cartesian coordinates of a location and that of the satellites are known. It would be of great help.
Thanks,
I do not have such a formula.
The HDOP, VDOP and PDOP are calculated from the satellite positions and the signal timing, and no consumer grade GPS unit gives you access to that data.
i want my GPS data to be plotted on chart as you have done above but i don’t know what edit in my html file code. Can you please help me plotting my data if i share my spreadsheets with you ?
If you convert your coordinates to UTM or Web Mercator this gives you the position in meters. Take the average of all of the points and use that as the “zero”, calculating the offsets from that point. Then you can plot the distribution around that point.
Hi Michael,
Can I calculate CEP using HDOP , VDOP and PDOP ?
Thanks
Alaeddine
Good question, but I do not know the answer.
Hello Michael,
I looked at your excel table and there is something i dont get. By using the first Lat-Lon pair on your excel (Lat:49.28805728 & Long:-122.9803498), i get other Easting & Northing results by using some UTM conversion sites.. You have: UTM Easting:-13690109.91, UTM Northing:6323880.783 but i get: UTM Easting:501428.94 & UTM Northing:5459478.70. Am i doing something wrong? Did you use WGS84 for your calculations? Please help me out.
Good eye!
Those are in fact spherical Mercator coordinates, not Universal Transverse Mercator. UTM divides the Mercator projection into zones, so to simplify the calculations I used Spherical Mercator so I didn’t have to account for zone boundaries.
Hi Micheal,
This is really good article and helped me alot, but when I tried to convert latitude/longitude into UTM it says Heading row not found
I recently did some of my own evaluations on a Garmin 66SR and began to troll the Internet to see if anyone else had done anything similar and I came across your site. I am not an expert with statistics, but I was glad to see someone else took a similar approach to analyzing the data (I took a 12 hour sample at 3 second interval and imported to QGIS only to export the track points to CSV with UTM coordinate and did the standard deviation calculations in LibreOffice). The 66SR had a single standard deviation of ~1.1m (I live in Portland, OR, USA and tested in a location with mostly open skies) – so I was kind of surprised you had a ~7.4m standard deviation because my 66SR had a standard deviation of ~1.8m in GPS only mode. I have done other tests of less sampling that indicated a standard deviation of ~4m under dense tree cover in a shallow canyon. One other comment, I think it to be good practice to multiply the standard deviation distance by 1.37 (or round to 1.4) in circumstances where the location you are looking for is marked previously by your device (if I took a waypoint with a 95% and wanted to return to it by GPS, wouldn’t that mean you had a 95% chance of 95% chance (or ~91% chance)?
Thanks for commenting.
The newer GPS units have GLONASS and some have GALILEO which gives more satellites to perform the calculation. For my tests I live near a huge rock cliff which likely made the accuracy lower.
Hi Michael,
It is very interesting to have the calculation of CEP . I have been searching for it for a month. Thanks that you have figured it out step by step. In what software did you use these codes. I have a short period of time hence can you send the software so that I can credit your name .
Would be interesting to see an update to this post with modern smartphone that have GLONASS, GALILEO and BeiDou on top of GPS.
What about smartphone apps that average position? Will they show standard deviation, whatever?